
SAOP
Overview
SOAP transforms raw government geodata into an actionable airspace risk classification. Switzerland has over 14,000 registered air navigation obstacles, transmission lines, cable cars, antenna masts, buildings, cranes, and the question this project answers is whether their spatial distribution reveals distinct risk zones that could inform drone corridor planning.
Data & Ingestion
The obstacle data comes from the BAZL's publicly available STAC API (collection ch.bazl.luftfahrthindernis) and is distributed as a KMZ file in WGS 84. A standalone Python script handles the full download-and-parse pipeline: it queries the API for the current asset URL, extracts the KML from the KMZ archive, and parses each Placemark's coordinates and ExtendedData attributes into a GeoDataFrame. Point geometries yield direct coordinates; LineString geometries (cable spans, transmission lines) are reduced to their midpoint. The result is a clean Parquet file with 14,334 obstacle records and 18 attributes. Swiss border geometries for the map overlays are fetched at runtime from the swisstopo REST API.
Feature Engineering
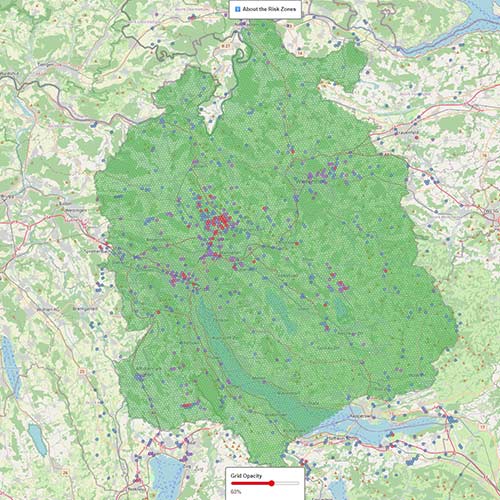
Rather than clustering individual obstacle points, the pipeline aggregates them onto Uber's H3 hexagonal grid at resolution 7 (~5.16 km² per cell). This produces 3,976 populated cells, each described by ten engineered features: obstacle count, three height statistics (mean, max, standard deviation), mean terrain elevation, linear and vertical type proportions, type diversity, lighting coverage, and an airport proximity flag. The type composition turned out to be especially informative, cells with high linear percentage (transmission corridors) and cells with high vertical percentage (built-up zones) are almost mutually exclusive (Pearson r = −0.66).

Clustering
Three methods were evaluated on the standardised feature matrix: HDBSCAN, K-Means, and DBSCAN. HDBSCAN produced fine-grained results but labelled nearly a quarter of all cells as noise. DBSCAN collapsed 77% of cells into a single dominant cluster. K-Means with k=4 achieved the highest silhouette score (0.363) and the most operationally interpretable segmentation. The four resulting zones are:
- Plateau Transmission (63.9%) - the Swiss Plateau's power grid, sparse low-height transmission lines
- Airport & Urban (13.9%) - high-density zones near airfields like LSZH and LSGG
- Alpine High-Rise (15.1%) - cable car infrastructure at high elevations, averaging 107 m obstacle height
- Urban Vertical (7.1%) - industrial zones dominated by buildings and cranes, 45% lighted
Coordinates were deliberately excluded from the feature set, so clusters reflect obstacle characteristics, not location. Despite this, the geographic overlay shows clear spatial coherence with recognisable Swiss landscapes.

Scalability
To demonstrate that the pipeline scales from strategic overview to operational granularity, the entire workflow is re-executed for Canton Zürich at H3 resolution 9 (~0.1 km² per cell), a 50x increase in spatial detail. This requires changing a single parameter (the resolution constant) with no architectural modifications. The result reveals neighbourhood-level risk transitions that are invisible at the national scale.
Tech Stack
Python 3.10+ · GeoPandas · Uber H3 · scikit-learn · HDBSCAN · Folium · Parquet · ElementTree · swisstopo REST API · BAZL STAC API